Supply Chain
How much to keep to avoid Stockouts?
In TOC replenishment solution the whole supply chain moves from a forecast driven system to a consumption-driven system. In the consumption-driven system, the stock-out and the surplus can be totally eliminated from the supply chain by supplying the next link with only what is sold/consumed by it and nothing more.
TOC Replenishment Solution
The below diagram illustrates how the consumption driven supply chain operates.

(The complete solution is shared in my article: What I learnt about inventory in Theory of Constraints (TOC) Paradigm?)
Now, the question arises that stock out can happen at a node during the time when the stock is in transit from the supply node.
To ensure that an item is available for consumption at a node during the replenishment lead-time, some starting inventory is required to be kept at the node- ‘How much do we need to keep to avoid stock outs’?
In this article, we would discuss the two questions ‘How much to keep’? as well as briefly cover the aspect of ‘What to keep’ at a node in the supply chain.
Before getting in details, let’s get to a common ground with some of the terms used extensively in the article.
Buffer Stock:
Buffer stock, the inventory kept at a location, acts as a shock absorber and delinks/protects the downstream entity from all the fluctuations and disruptions in the supply chain at the upstream.
Replenishment Lead Time (RLT):
The total time is taken from the generation of a need of inventory at a node to the fulfilment of that need.
Stock Keeping Unit (SKU):
Stock keeping unit (SKU) is a product and service identification code for a store or product. SKU is often depicted as a bar code that helps track the item for inventory.
How much to keep?
Buffer is needed to protect the sales during the replenishment lead-time from previous node.
It is observed that whenever the question of keeping stock at a node arises, the familiar answer is to keep average of past consumption. By definition average stock can suffice for only 50% of the cases, leaving a huge headroom where the sales loss due to unavailability can happen. So to cover for all possible sales scenarios “Maximum consumption in the replenishment lead-time” should be considered.
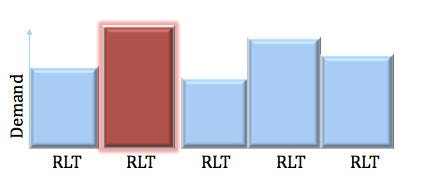
Note: — Consumption at any location- Stocks of SKU, which moves out of the location for fulfilling the customer demand.
Step 1:
Establish the Replenishment Lead Time (RLT) between the two nodes of a supply chain for an item.
Step 2:
Plot the sum of consumption/demand in the RLT for a significant past period (a period which covers all aspect of consumption- seasons/festivals etc. — usually a year is a good enough period).
Step 3:
Choose the max consumption bucket as the norm for the item.
Example:
Let’s assume RLT as 20 days. Now, plot and combine last one-year sales or order data in 20-days continuous buckets.
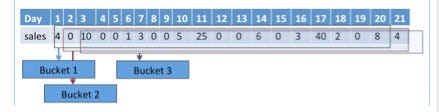
A buckets indicates the sum of the sales in the RLT. The buckets are taken for continuous set of 20 days to ensure that consumption during any period of continuous 20 days is considered. Bucket 1 is the sum of sales in 1st to 20th day, Bucket 2 is the sum of sales in 2nd to 21st day, the third bucket is the sum of sales in 3rd to 22nd day and so on and so forth.
The max consumption bucket of 20 days is taken as the ‘Buffer’ for that SKU.
There is one limitation with the concept of considering max (Step 3)- Dataset can contain some outliers i.e. very high daily sales compared to the normal sales pattern. Example- Sales of 100 on a day when sales on other days is in range of 5–15.
Manually removing such spike points from bases sales data and then taking the max of the bucket can solve this limitation. But if the number of data points is large then manual removal is a time consuming exercise. In such cases, the concept of normal distribution can be used for the computation of buffer inventory.
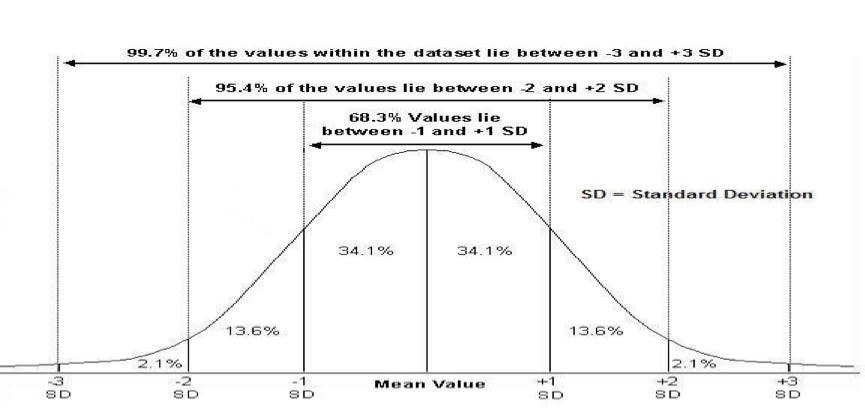
Continuing the example: Calculate the average and standard deviation of the buckets. The average plus twice of standard deviation gives around 98% coverage of all the data points and thereby removing the effect of 2 % of extreme right cases ( the erratic dataset).
Note: Base sales data must contain at-least 30 data points in the considered period for materialisation of normal distribution.
Practical approach of establishing RLT
1) Between warehouse and Plant/Vendor
RLT from vendor/plant to warehouse for a SKU- The best way to estimate the RLT is to have a discussion with the vendors/plant to understand the actual touch time in the manufacturing of the SKU and also the number of cycles in a month/period the SKU is taken up for the production.
In case vendor base is large and such discussion are not possible with all of the vendors then the frequency of in-warding of SKU (number of times the SKU is received by the warehouse from supplier/vendor) in warehouse from vendor/plant can be taken as proxy for the above two factors.
Higher the frequency lower is the RLT and vice versa.
2) Between warehouse and distributor
The RLT between the warehouse and distributor can be considered as actual transit time between warehouse & distributor plus warehouse processing time .
What data to be used for calculation?
Daily sales(primary or secondary) or daily order data can be taken for capturing consumption. Both sales and order data have following pros and cons.
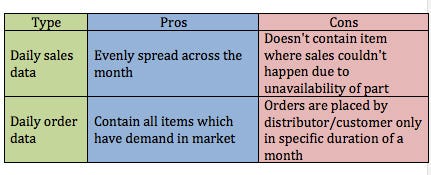
It is suggested to take the sales data for plotting and bucketing and then do a check based upon the order data.
What SKUs to be considered in norms for a node in supply chain?
SKUs which company is selling in a particular market must be kept in the buffer list for the location. This is called as “Relevant Range”.
The decision for keeping any SKU at a location is a function of customer tolerance time and supply lead time. If the customer is not willing to wait (Supply lead time>customer tolerance time) for that SKU, it is required to be kept in buffer at the location.
The following factors can act as guiding measures to arrive at the relevant range:
- The frequency of sale of SKU in the past period
Frequency (sale rate) plays an important in deciding the list of parts that can be considered for a location. Items with a very low frequency indicate a very erratic demand for the part and hence those can be excluded from the list of items to be kept (can be served based upon orders from upstream nodes within the tolerance time)
- Service level to the customer
If the customer needs a higher degree of service level then the product is to be kept at the consumption node irrespective of the frequency of the consumption.
The above steps serves as a DIY guide for one for setting up the buffers/norms in the supply chain.
PS: PM me if you need an example in excel sheet with formulas.

Strategy, supply chain & sales transformation consultant. About · Book a discussion